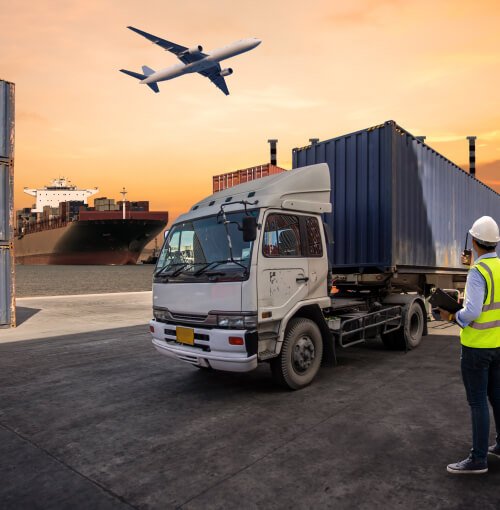
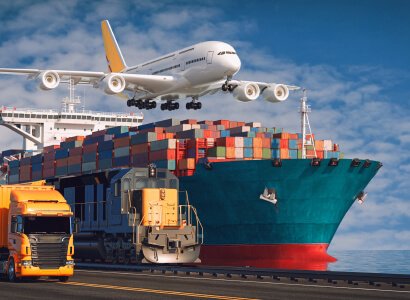
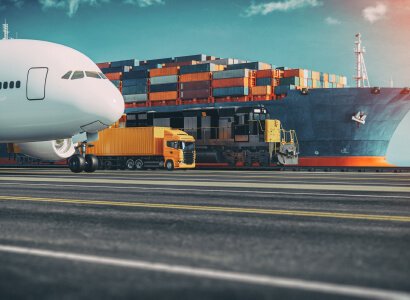
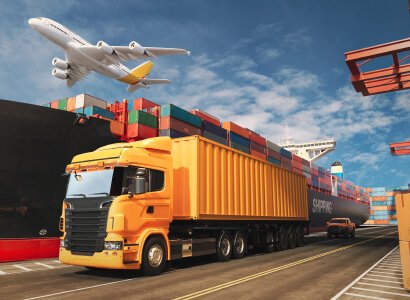
Unlock Your Data's Full Potential Today

Transform complex data into actionable insights for growth.

Real-Time Insights

Monitor key metrics and drive informed decisions.

Visualize data with interactive dashboards for clarity.

Identify trends and seize business opportunities effectively.

Data Visualization
AI-Powered Analytics

Unlock Your Data Potential

At Clarilytics, we transform complex data into actionable insights, empowering businesses to drive growth and innovation through advanced BI and AI analytics.

An iPad displaying data visualization content next to a book titled 'Data Science for Business.' The iPad is showing notes and a diagram about dashboard design, accompanied by a stylus placed between the iPad and the book.
A computer screen displaying a data analytics dashboard with graphs and charts. A blue line graph shows fluctuations in data over time, and a section highlights the number of page views. A pie chart is partially visible, indicating a breakdown of different data elements.
A digital screen displaying analytical data with line graphs, histograms, and numerical values. The data is presented in a user-friendly interface with different shades of blue used to distinguish various elements.

Our Mission Statement

We specialize in business intelligence and data visualization, helping organizations monitor metrics, identify trends, and improve operational efficiency for enhanced profitability.

Data Insights Solutions

Transforming complex data into actionable insights to drive growth and operational efficiency for businesses.

Real-Time Monitoring

Empowering organizations to track key metrics and visualize data through interactive dashboards and analytics.

A computer screen displaying analytics dashboards with various charts, including a line graph on the left and a cohort analysis table on the right. The table is populated with different shades of blue, indicating varying levels of user activity over several weeks. Text labels and numbers detail user retention statistics.
AI-Powered Analytics

Utilizing advanced AI tools to uncover trends, patterns, and opportunities for enhanced business performance.

Unlocking data potential through tailored business intelligence solutions that foster innovation and profitability.

Business Intelligence Tools
A laptop displaying a dashboard with various graphs, charts, and numeric data. The screen is partially visible, showcasing sections with line graphs, financial figures, and small images. The background is blurred with a prominent red light creating a warm ambiance.
A laptop with an open screen displaying dashboard analytics featuring charts, graphs, and numerical data related to sales and subscriptions. The interface is predominantly dark-themed with sections highlighting key performance metrics. The device shown is a MacBook Pro, indicated by the keyboard layout and branding.

Clarilytics transformed our data into actionable insights, driving growth and improving our operational efficiency significantly.

Allan Rub

A person is viewing a map with red data points on a computer monitor, likely indicating a geographical distribution. The image has a focus on technology and data analysis.
laptop computer on glass-top table

★★★★★

industries we serve

Serving a wide range of industries with edge-cutting performance evolution and optimal results as efficiently as possible.

gray curtain building during daytime
Finance & Banking

Monitor risk, transactions, and fraud detection.

Healthcare

Optimize patient care and operational efficiency.

E-commerce

Track sales, customer behavior & marketing performance.

Retail and manufacturing

Improve inventory management and customer insights, Analyze production efficiency and supply chain metrics.